
01 · Understand
“Summarize this dashboard.”
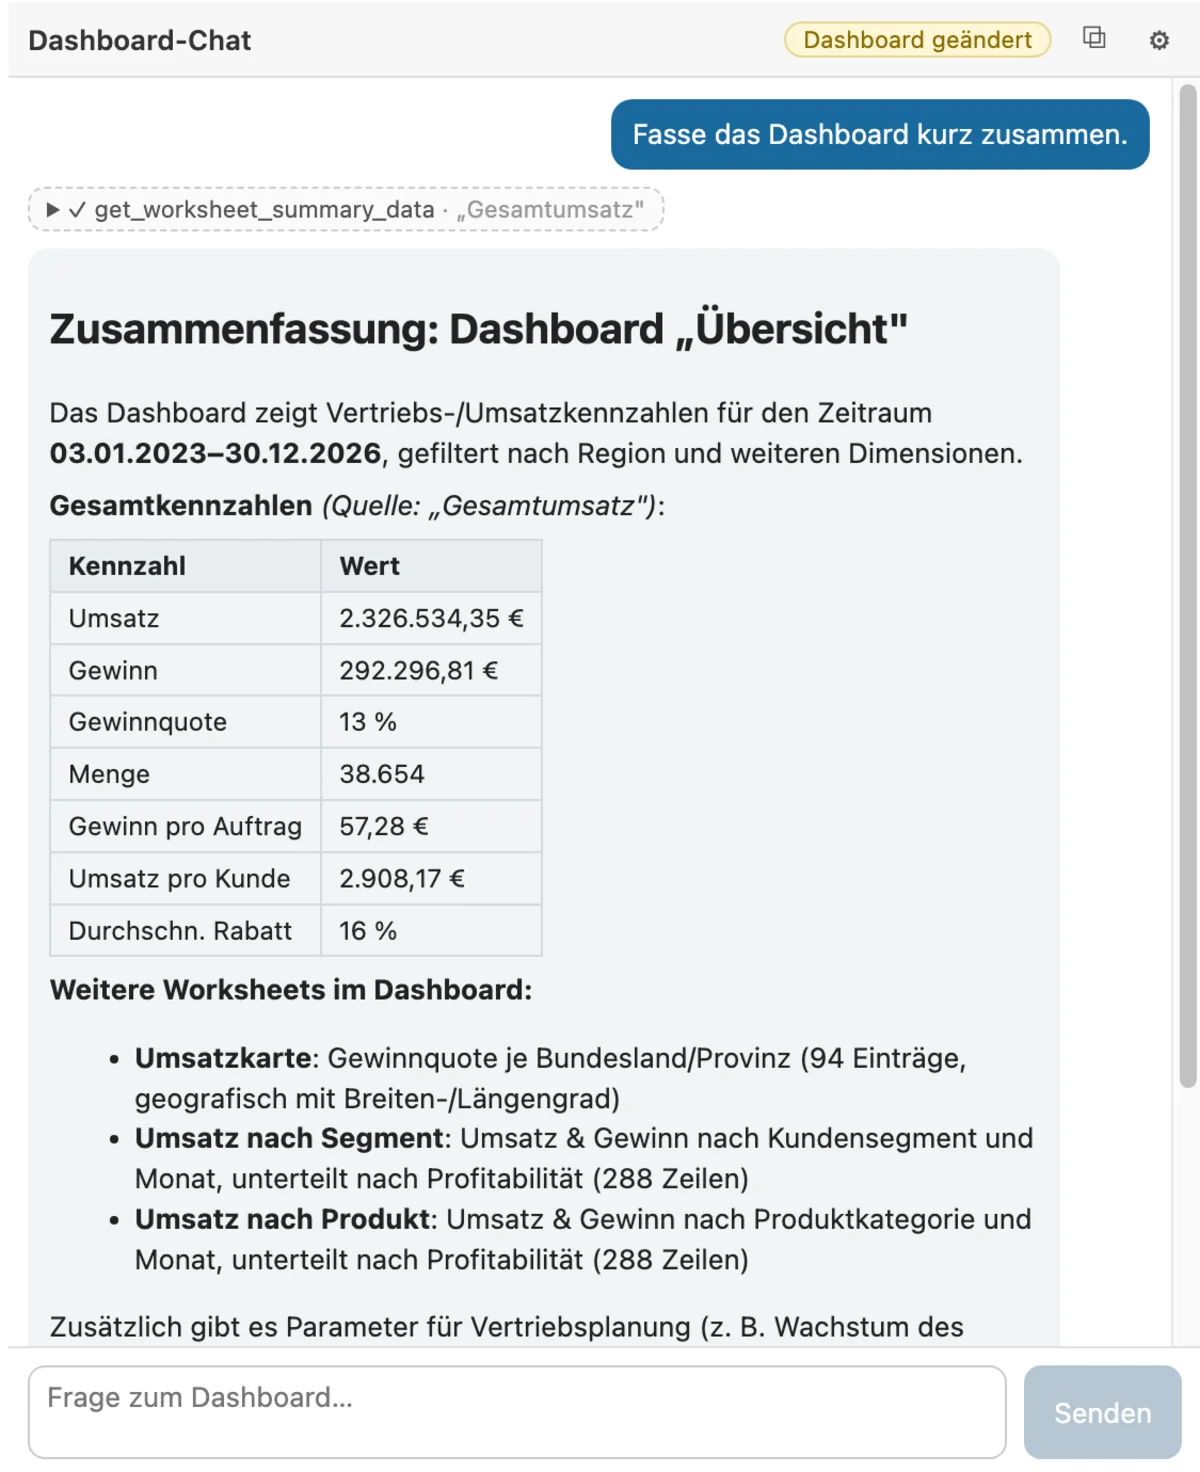
Key statements, a metrics table, the active filters. Every figure with the worksheet it came from.
OpenVizPilot for Tableau
OpenVizPilot answers questions right inside the Tableau dashboard, using the current context and the permissions of the signed-in user.
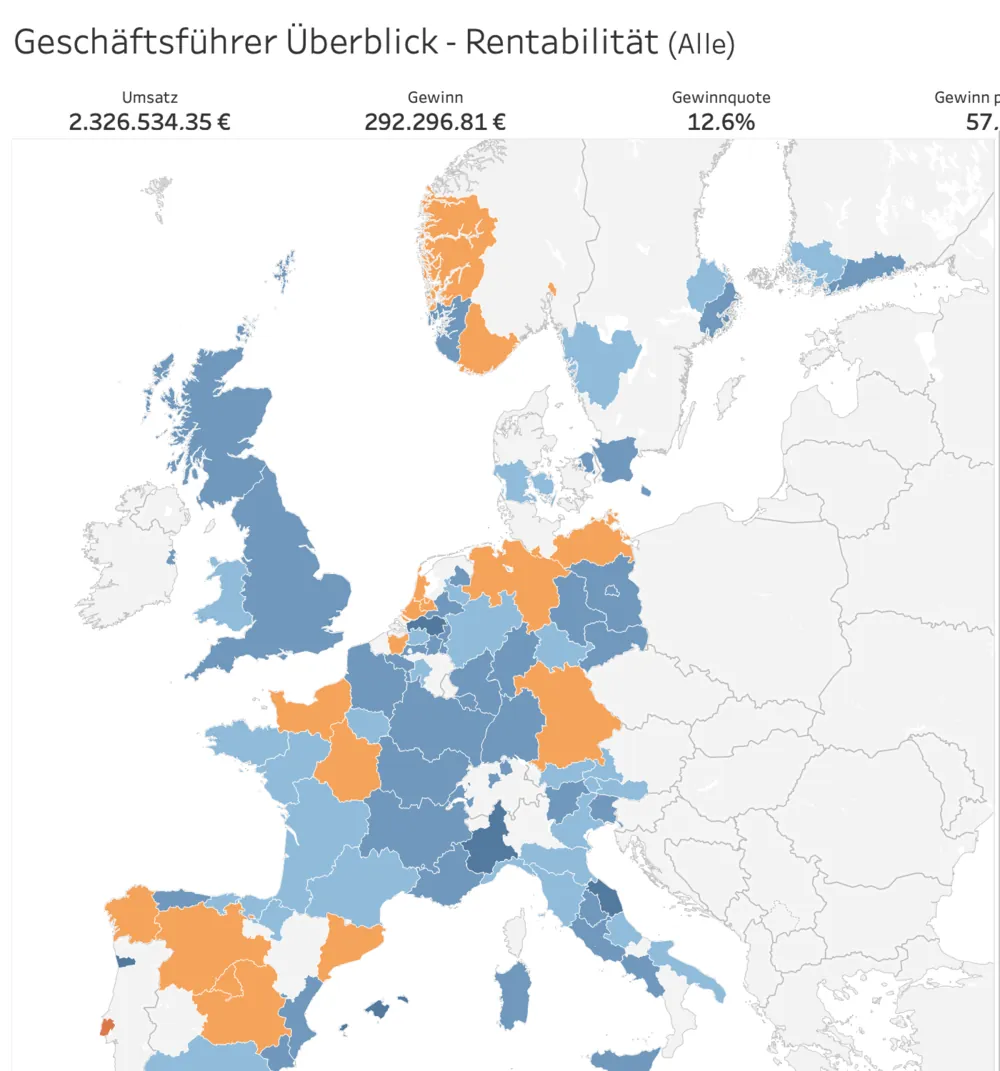
Executive Overview - Profitability (All)
Sales
€2,326,534.35
Profit
€292,296.81
Profit ratio
12.6%
Profit per order
€57.28
Monthly sales by product category
worksheet: "Sales by product"
groupBy: ["Category"]
measures: ["SUM(Sales)", "SUM(Profit)"]
→ Grouped across all data pages · no full-data permission required
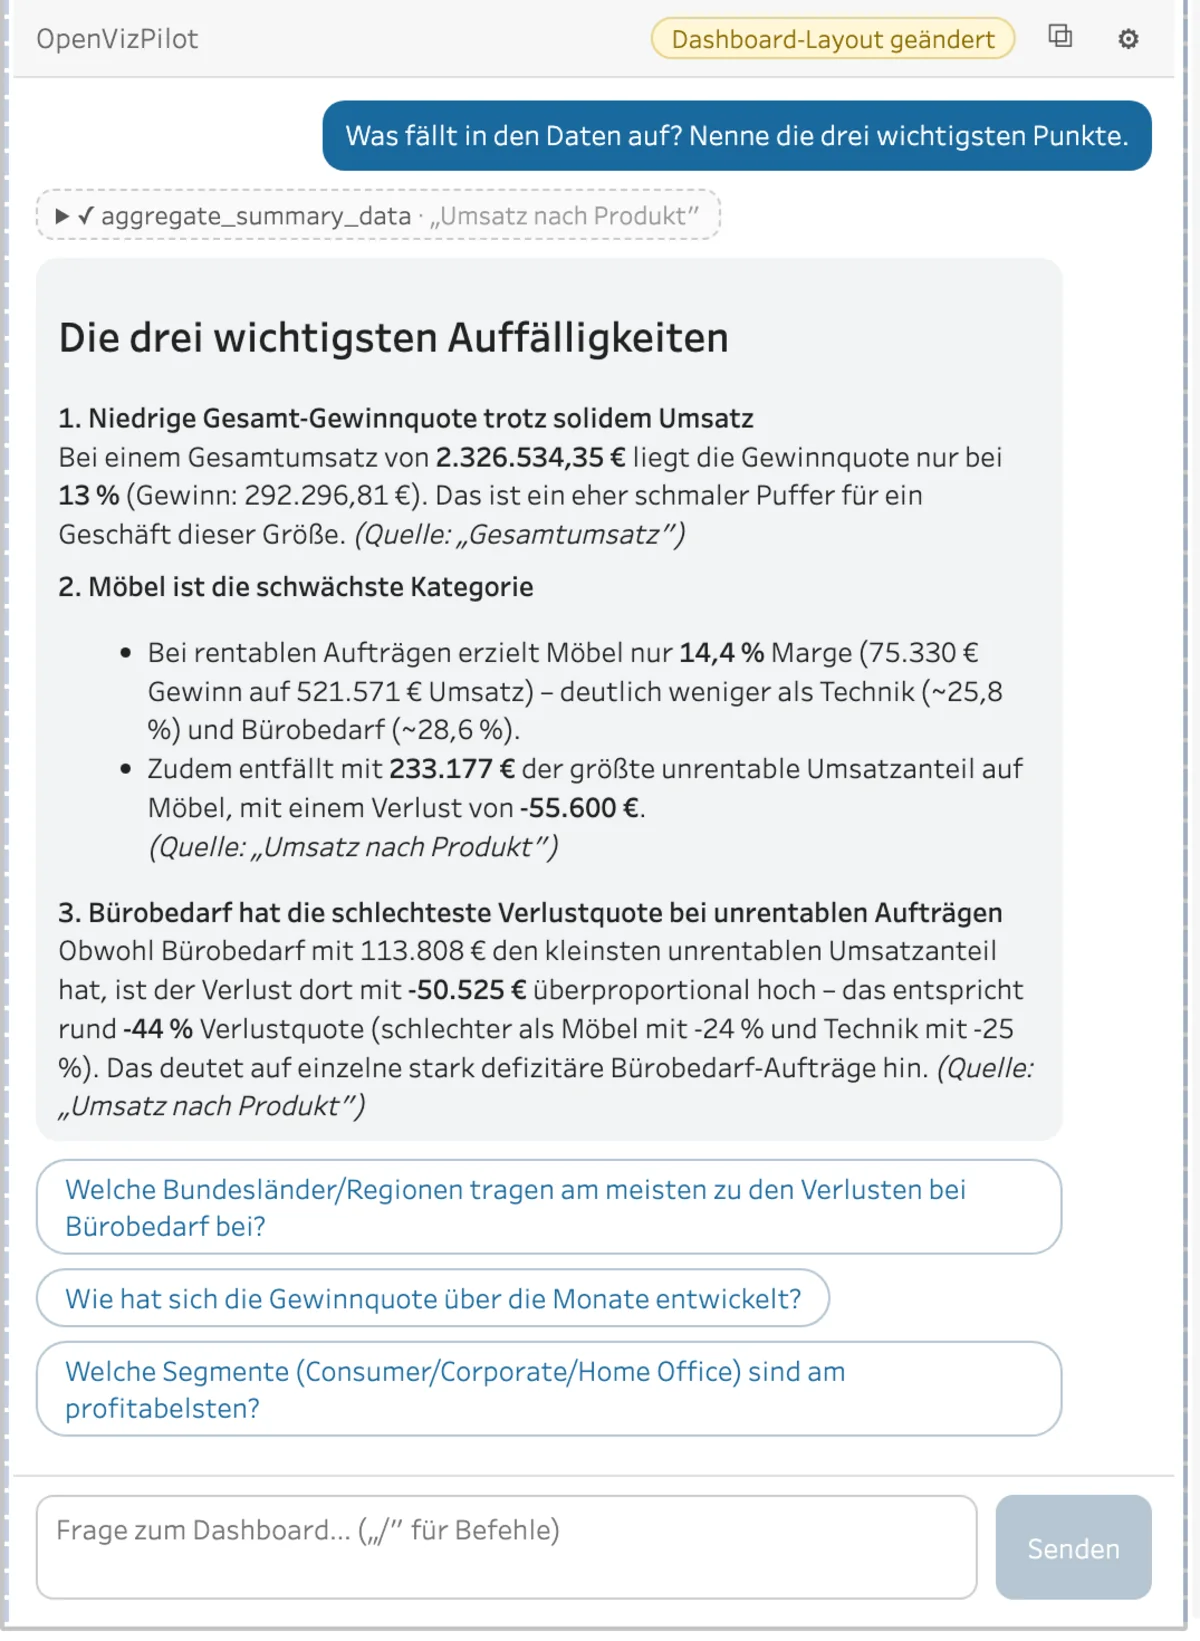
The three most important findings
1. Low overall profit ratio despite solid revenue
On total revenue of €2,326,534.35 the profit ratio is only 13% (profit: €292,296.81).
2. Furniture is the weakest category
Only 14.4% margin on profitable orders – well below Technology (~25.8%) and Office Supplies (~28.6%). It also carries the largest unprofitable share at €233,177.
3. Office Supplies has the worst loss ratio on unprofitable orders
A loss of -€50,525 on €113,808 of revenue – roughly -44%.
Tip: click a source to highlight its worksheet in the dashboard.
Create this rule?
This rule reads data server-side on your behalf — like other server queries, this requires your consent. The rule keeps running even when you are not signed in.
How an alert arrives in Microsoft Teams (example)
Microsoft Teams · OpenVizPilot
Alert: Profit ratio below 10%
The profit ratio has dropped below the 10% threshold.
Open analysisClick a question: sources highlight their worksheet, tool calls expand, and a rule is only created after you confirm.
Illustration with sample data. The answers come from real product output but run here without AI.
01 · Understand
Key statements, a metrics table, the active filters. Every figure with the worksheet it came from.
02 · Investigate
OpenVizPilot aggregates the summary data itself and names outliers, weak categories and unusual ratios. With figures, not impressions.
03 · Act Enterprise
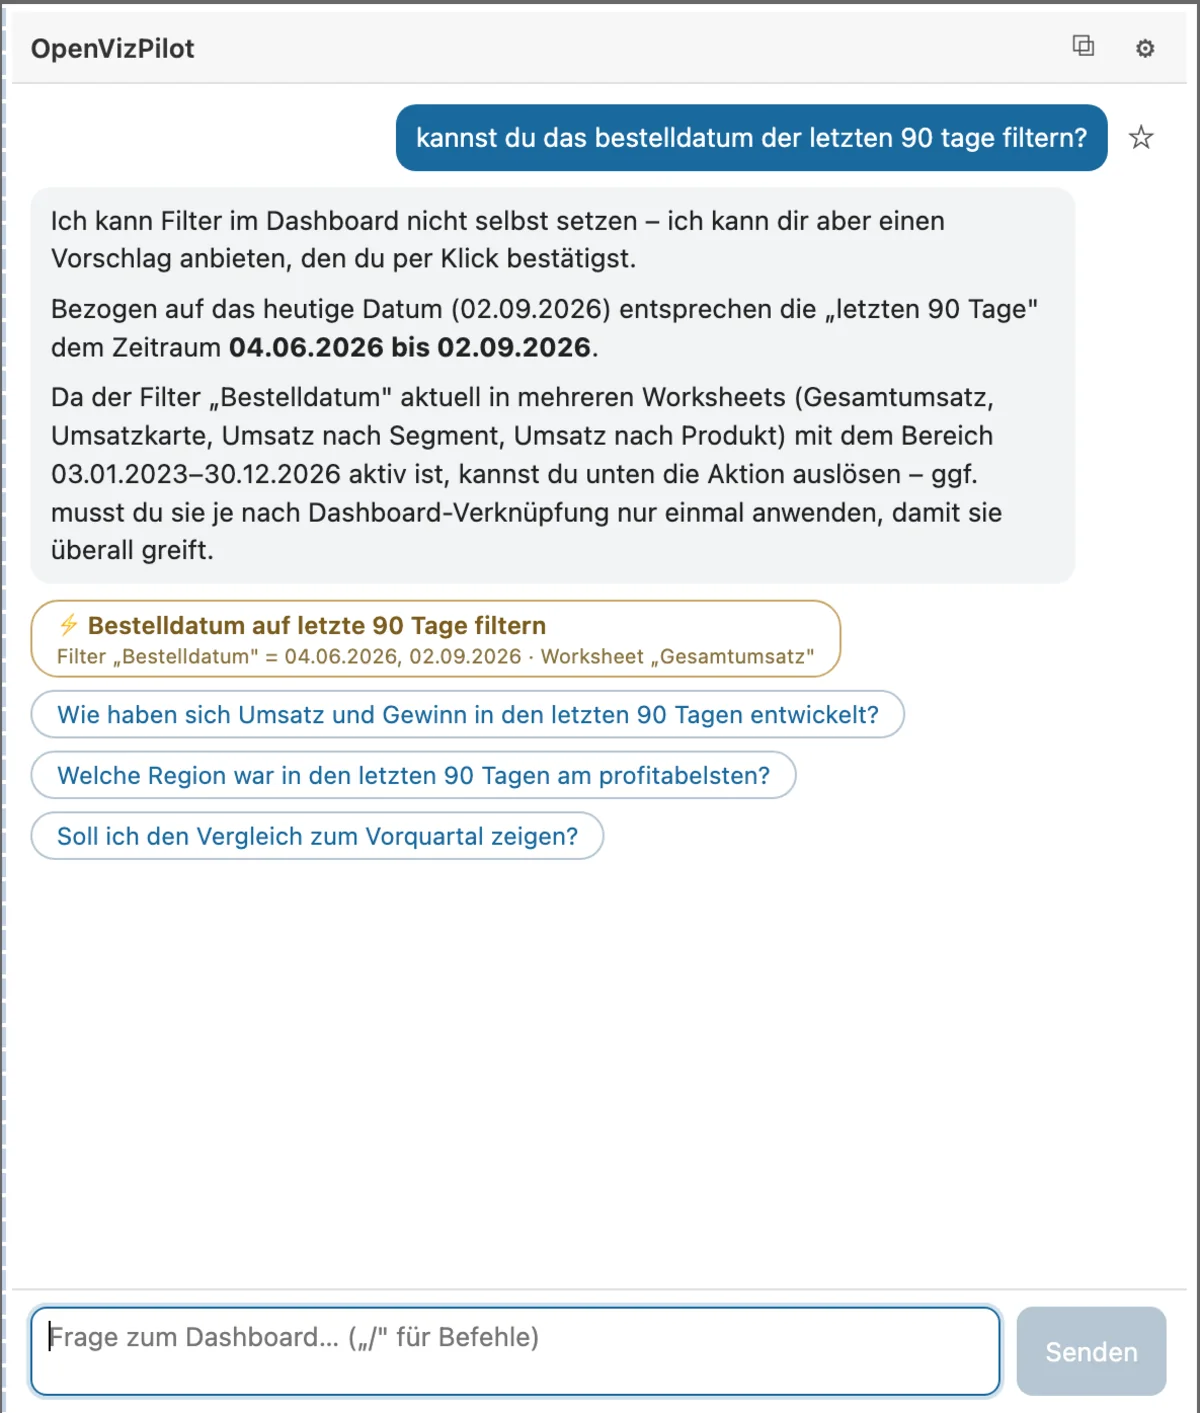
The filter arrives as a plain-text proposal. You click, the dashboard changes. Not the other way round.
Investigate mode
The assistant first writes an analysis plan, works through it with several tool calls, and closes with main cause, evidence and sources.
OpenVizPilot reads dashboard data in the Tableau session of the signed-in user. Row-level security and user filters apply unchanged. The middleware has no Tableau identity of its own – no service account, no personal access token. It caches no dashboard data and stores no chat history.
Extensions API
Data access runs in the user’s browser, in their Tableau session.
Summary data
No full-data permission needed. The extension reads only what the dashboard shows.
Click, not automation
Filters, parameters and highlights change only when the user clicks a chip.
Scope guard
A small classifier model rejects off-topic questions server-side before they reach the main model.
The extension and middleware run on your side: with Docker Compose on a Linux VM or via Helm chart on Kubernetes. You connect the language model through an OpenAI-compatible endpoint – for example LiteLLM, vLLM, Ollama or a proxy in front of Azure OpenAI. Where questions and data context go is your decision.
Same extension, same chat window. Enterprise adds what companies need for a rollout.
SSO
OIDC with Microsoft Entra ID, Keycloak or other providers. The ID token is verified on every request.
Actions
Filters, parameters, highlights, showing and hiding zones – proposed as a chip, executed on click.
Memory
Role and preferred views are remembered. Visible and deletable in the panel.
Saved queries
Answer focus and up to five standard questions per dashboard and user.
MCP
Approved data sources and web search, assigned per site, dashboard and member. External queries only after consent.
Tableau Server
Workbooks, views, field definitions and formulas in the same chat. Tableau Server 2024.2 or newer, via Connected App.
Server Data
Reads views outside the open dashboard server-side on the user’s behalf – only after admin approval, the site switch and one-time consent. Every access is logged 90 days, pseudonymized, in the audit trail.
Watch
Rules start as a chat proposal confirmed by a human. Checked on a schedule, delivered via webhook, Microsoft Teams or email – the alert text is deleted right after delivery.
Cross-Dashboard
Investigate mode can widen scope to the entire Tableau environment: the assistant also searches published data sources with their fields, tables and dependent workbooks, reads at most five views per question and – behind its own site switch – queries data sources itself (Tableau Cloud or Server 2025.1+). A fixed query budget caps server access, and every answer carries its source list.
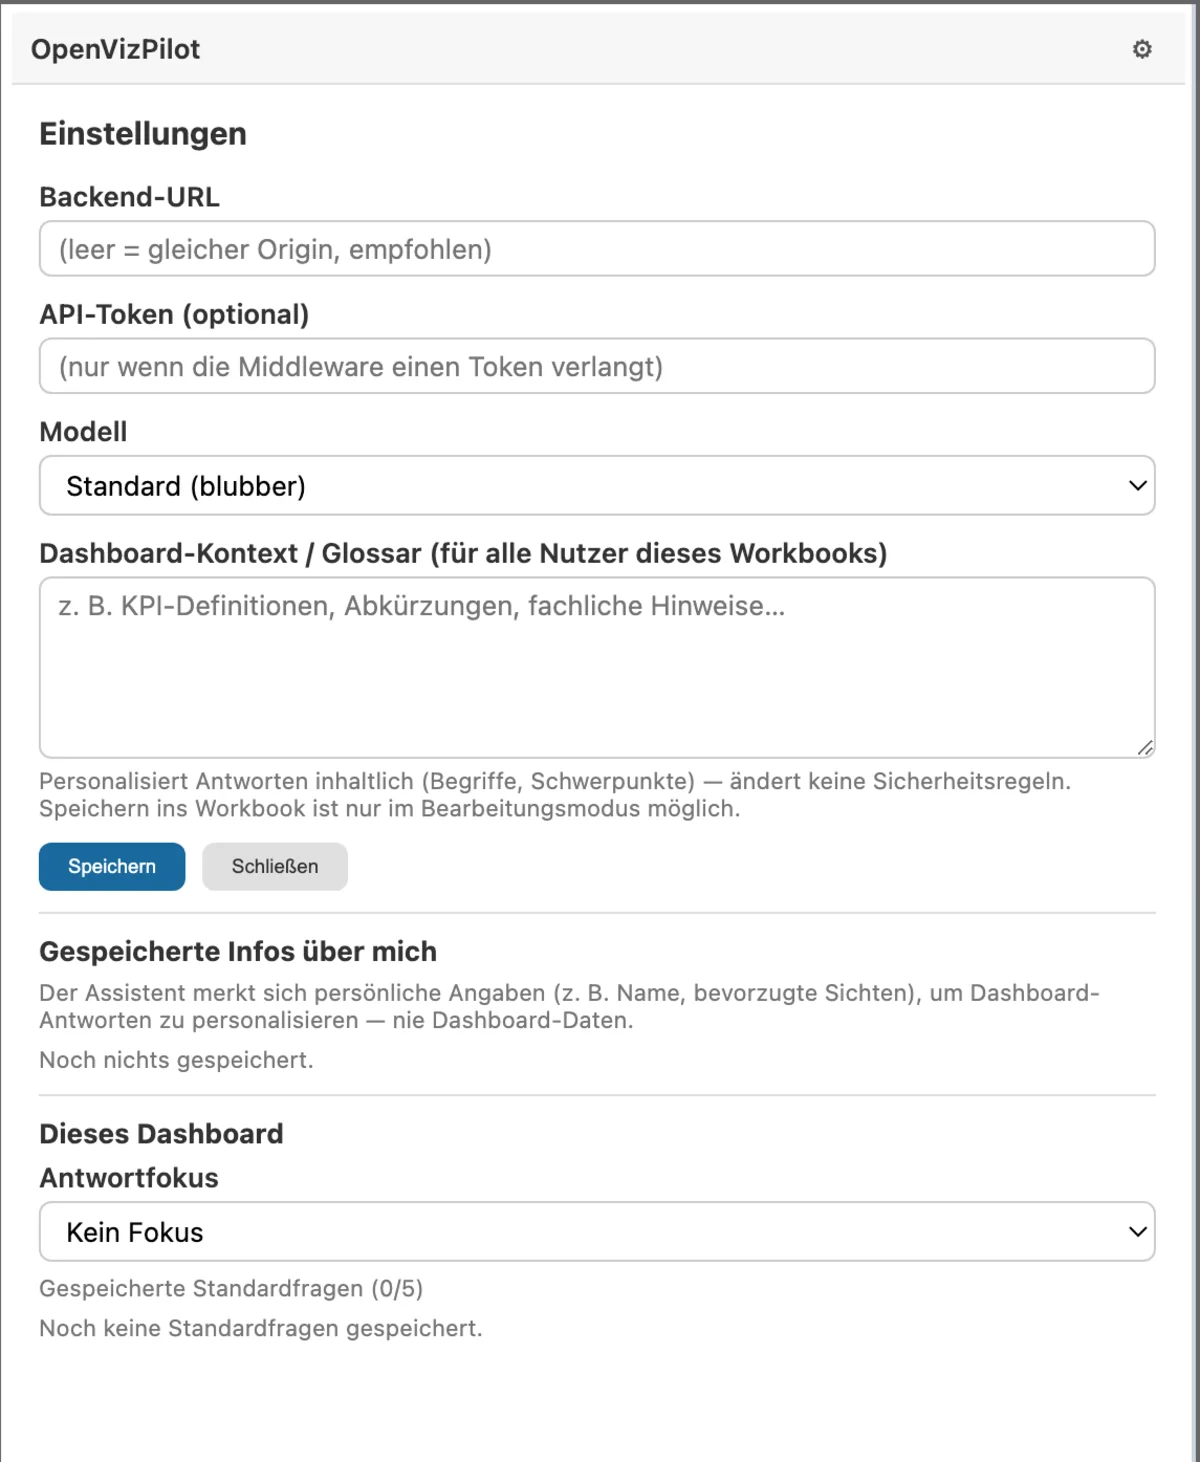
Model catalog, slash commands, standard questions and the maximum tool rounds per dashboard, license and SSO are managed in the admin UI – no redeploy. The overview shows the version with an update notice and LLM usage. Core and Enterprise.
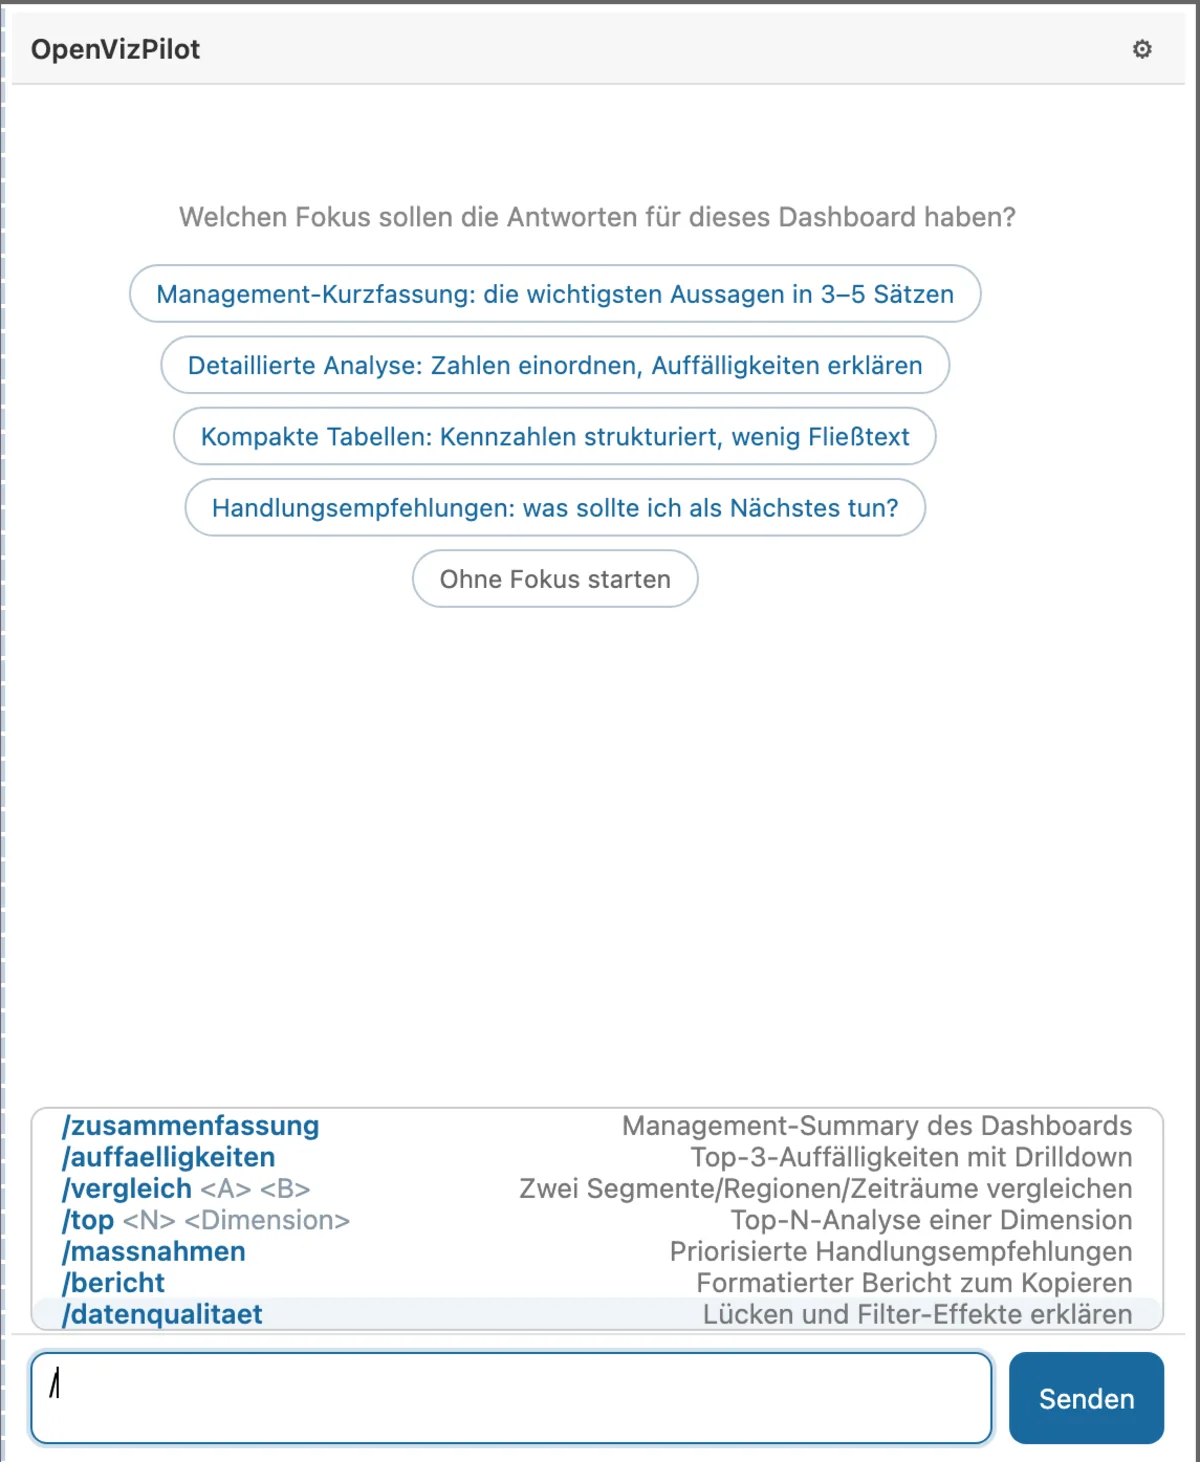
The extension sits inside the Tableau dashboard and executes tool calls in the browser. The stateless middleware adds the system prompt and tool definitions and streams the answer. The LLM endpoint is yours. Enterprise adds further data paths: Tableau Server metadata under the user’s verified identity, data from further views read server-side on their behalf, and scheduled Watch rules.
OpenVizPilot Enterprise
€14,500
net / year per production Tableau environment
Associated dev, test and staging environments included.
No additional per-user license.
AI model and infrastructure costs are borne by the customer. Planned features are not a contractual commitment.
We offer adjusted terms for smaller teams. Tell us briefly how many dashboards and users are involved.
€1,500 one-time
Kickoff and architecture review, installation and production deployment, SSO via Entra ID or Keycloak, connection of an OpenAI-compatible LLM endpoint, integration in up to three dashboards, validation of permissions and row-level security, admin training, up to 8 hours of go-live support.
Additional dashboards, integrations or customizations are quoted by effort.
Core answers questions about the open dashboard. Enterprise adds company sign-in, personal assistance, confirmed actions and additional data sources. It is the same extension with the same chat window.
For analysis of what users can see in their dashboard. Admins manage models and shared analysis prompts; local accounts provide sign-in. The source is available under PolyForm Noncommercial (source available) and free for noncommercial use. Commercial Core use also requires an agreement.
For teams needing company sign-in, personal settings and additional data sources. Personal saved questions belong to the individual; shared dashboard questions are already in Core. Extended discovery of Tableau content and field definitions belongs to Enterprise and uses the same chat window.
The matrix maps capabilities to editions, including intended additions; it does not imply immediate availability of every feature. The binding scope and availability for your deployment are agreed in the offer.
| Capability | Core | Enterprise |
|---|---|---|
| Dashboard chat: visible measures, filters and parameters | Assigned | Assigned |
| Source references, visible tool calls and Markdown export | Assigned | Assigned |
| Your model endpoint and a centrally managed model catalog | Assigned | Assigned |
| Glossary, slash commands and shared dashboard questions | Assigned | Assigned |
| Local user accounts and admin interface | Assigned | Assigned |
| Self-hosting via Docker Compose or Helm; aggregate usage overview | Assigned | Assigned |
| Approve AI chat and Tableau API access separately per user | Assigned | Assigned |
| SSO via Entra ID, Keycloak or other OIDC providers | Not assigned | Assigned |
| Personal memory, answer focus and saved questions | Not assigned | Assigned |
| Dashboard actions: filters, parameters, marks and zones after a click | Not assigned | Assigned |
| Approved MCP sources and web search with confirmation | Not assigned | Assigned |
| Tableau Server: find accessible workbooks and views in chat | Not assigned | Assigned |
| Explain field definitions and calculation formulas | Not assigned | Assigned |
| Data dictionary: fields, descriptions and known dependencies | Not assigned | Assigned |
| Visually trace data origins and the impact of changes | Not assigned | Assigned |
| Explain data freshness, datasource health, access rights and changes | Not assigned | Assigned |
| AI assistance for administration and server-wide analysis | Not assigned | Assigned |
Checkmark = assigned to this edition. Enterprise also covers Core capabilities. A user approval in Core does not replace an Enterprise license.
Ask both questions in the OpenVizPilot chat inside your dashboard. Only the queried source differs.
Core + Enterprise
Chat → question → visible dashboard data in your Tableau session → AI analysis → answer with sources in the same chat.
Enterprise
Chat → question → accessible field definitions and formulas via Tableau Server APIs → AI explanation → answer with sources in the same chat. No second chat window.
Your IT team sets up the additional Tableau connection. Users sign in with their company account and see only content they are permitted to access. Admins approve AI chat and Tableau API access separately; API questions in chat require both. The extension explains available metadata and formulas, not arbitrary data across the entire server. Answers can be checked against their sources.
The OpenVizPilot core is published under the PolyForm Noncommercial license and free for noncommercial use. Commercial use requires an agreement. Enterprise capabilities are proprietary and unlocked with a license key. The code can be audited – before you buy.

Request a demo. Tell us how you use Tableau and which questions your team wants to answer in its dashboards.